To say that global geopolitical, trade flows and economic structures are stressed would be an understatement. Over the course of the last two years, a heightened sense of uncertainty has permeated our lives and the markets we depend on, though there are shimmers of light and reasons to be hopeful.
One segment of the pulp & paper industry that continues to rapidly evolve is tissue and towel. There has been some reshuffling and settling since the onset of the pandemic two years ago, and society seems determined to return to normalcy – whatever that may look like. The global tissue sector also looks drastically different than it did in 2019.
Below are 10 interesting facts about the current state of Tissue and Towel.
1. Global tissue is a roughly 60MM st market, which is about 10-15% of the global pulp and paper market. As illustrated in the image below, Asia now accounts for almost half of the world’s tissue machine capacity.
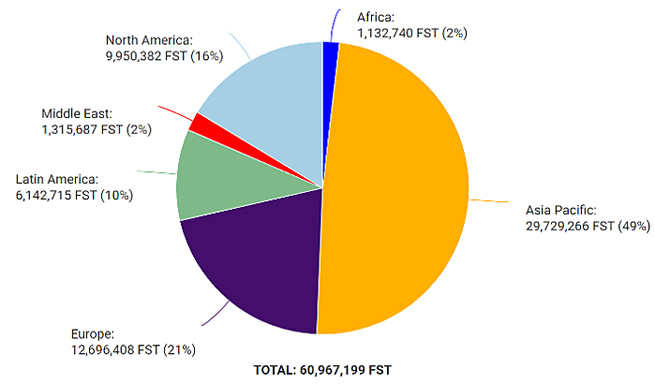 Source: FisherSolve Next
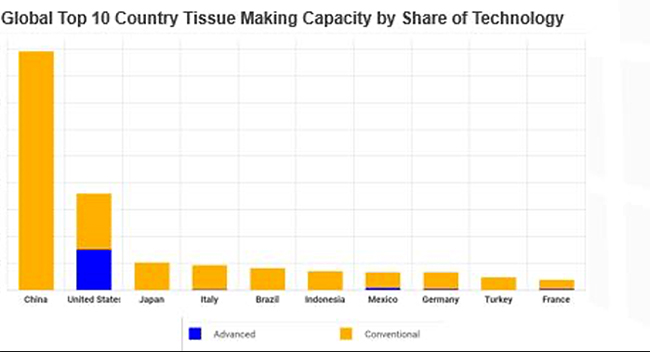
2. Population and urbanization drive tissue production. The graph below illustrates the top tissue producing countries. China’s capacity is much larger than the next several countries combined; the United States is also a very important tissue producer, with about half of China’s capacity.
 Source: FisherSolve Next
3. Tissue is a “local” business. This means that most regional tissue production stays close to home (versus other grades such as market pulp and containerboard which are shipped to far away markets). Over 95% of North American and European tissue production stays in their own markets.
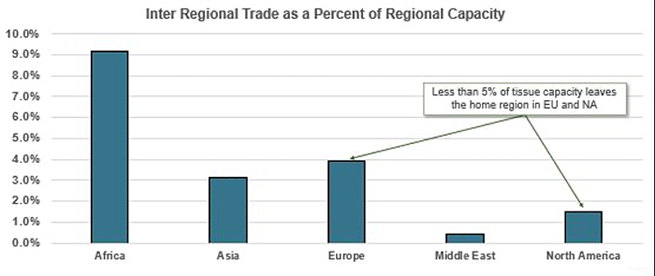 Source: FisherSolve Next
4. New investment in tissue has been driven by Asia, which accounts for 70% of total global new machine capacity since 2010. The chart below illustrates new capacity by machine build year and provides an indication of where capital has been flowing. Asian investments have been mostly in China, which has now resulted in a significant overhang.
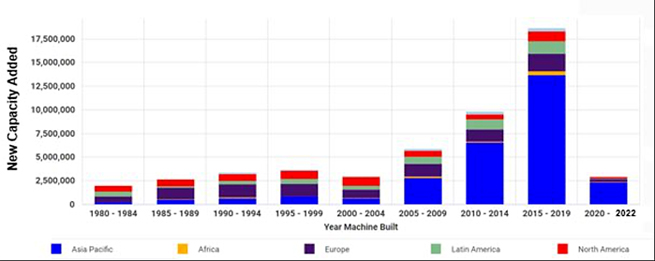 Source: FisherSolve Next
5. Tissue supply is mostly fragmented everywhere in the world – specifically in Asia. Companies rarely exceed 20% capacity share in any regional geography.
 Source: FisherSolve Next
6. Like politics, tissue dynamics are local. The chart below shows the top 10 global tissue producing companies and their manufacturing footprint. Of the top 10 companies, only two operate in more than two regions. This fact reinforces the notion that tissue is a local business.
 Source: FisherSolve Next
7. Tissue mills buy market pulp for most of their fiber furnish – As illustrated below, about 80% of global tissue is made using purchased pulp. Considering that pulp makes up 60% of parent roll costs for the average global tissue mill, it should be no surprise that it is also the largest single driver of cost on average.
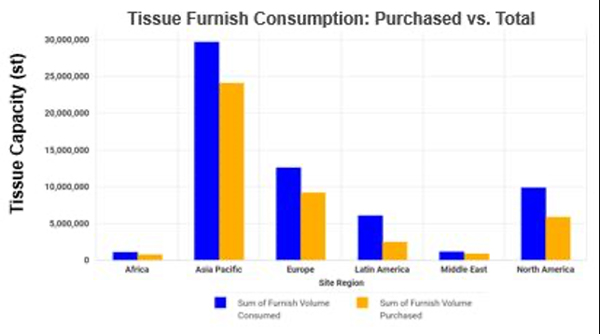
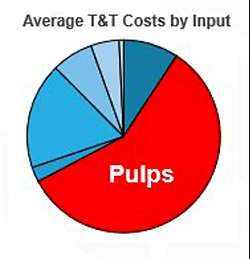 Source: FisherSolve Next
8. Globally, tissue prices and pulp prices share turning points. This then leads to another attribute of these types of markets, which is the price correlation. Using FisherSolve’s Market Module, we can analyze the calculated trade derived weighted tissue prices for selected regions and acknowledge the correlation coefficient between pulp and tissue prices which is quite high (about 0.6 R2).
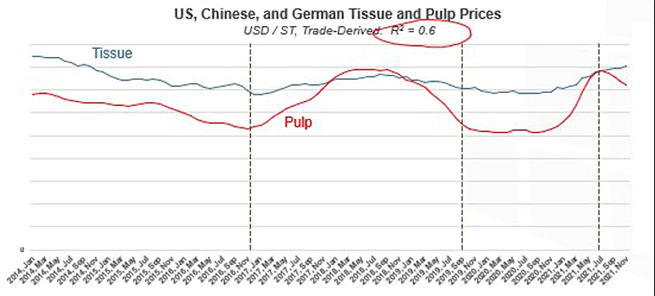 Source: FisherSolve Next
9. The US is unique regarding the high share of advanced technology machines in tissue production – comprising 90% of the world’s market for TAD, NTT, etc. This is because US consumers prefer and demand higher-end tissue products that are soft and absorbent.
 Source: FisherSolve Next
10. We expect global tissue demand to grow 1-5% in the coming decade – with the most growth occurring in Asia.
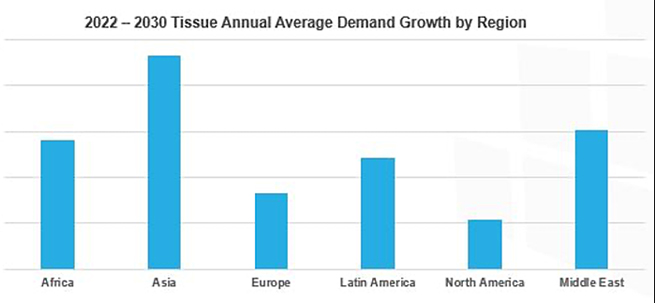 Source: FisherSolve Next
In a follow-up post, we’ll look more closely at the current state of the tissue market, and the forces that will shape the next five years. To make sure you don’t miss our next post, sign up for Fisher’s weekly blog updates.

Source: Forest2Market